FEATURED PROJECT · 2026 · MEDICAL IoT / EMBEDDED SYSTEM
01
NEWS2-BASED
IoT VITAL SIGN
MONITORING SYSTEM
An end-to-end engineering prototype that acquires multiple physiological parameters, transmits them through BLE, Wi-Fi and MQTT, processes and stores them on a backend, calculates NEWS2 risk, and presents the result on both a web dashboard and local indicators.
01 / PROJECT CONTEXT
WHY THIS SYSTEM?
Vital-sign values are useful, but the engineering goal was to turn separate measurements into one integrated monitoring workflow that can provide an early risk indicator instead of only displaying raw sensor numbers.
Multiple physiological parameters are commonly measured separately and still require structured interpretation and documentation.
Integrate acquisition, communication, database storage, NEWS2 scoring, dashboard visualization, history, and local alerts into one prototype.
The system is a monitoring and early-warning research prototype. It is not a diagnostic medical device.
02 / MY ROLE
END-TO-END ENGINEERING RESPONSIBILITY
This final project covered the complete prototype lifecycle: system architecture, hardware integration, ESP32 firmware, BLE/Wi-Fi/MQTT communication, backend and database integration, web dashboard, NEWS2 logic, mechanical packaging, functional testing, data analysis, and technical documentation.
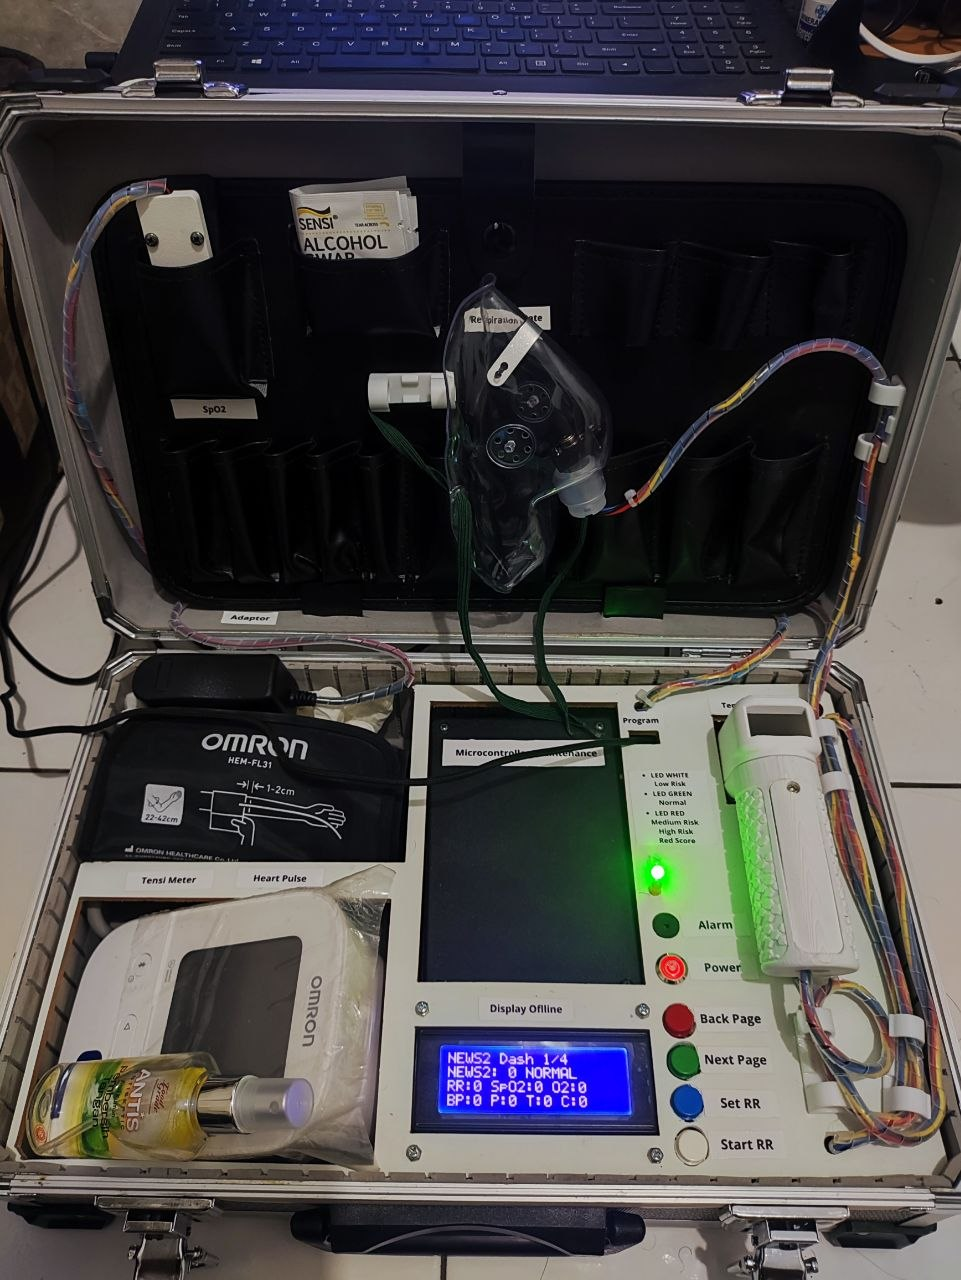
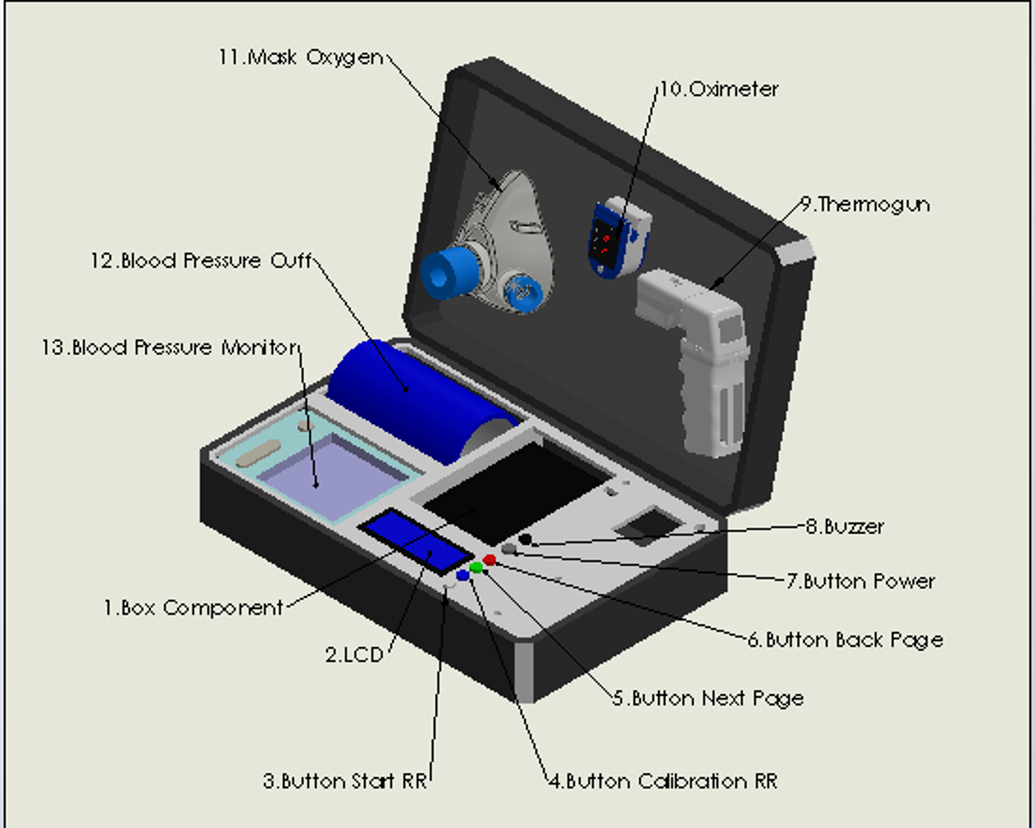
Sensor integration, I²C buses, BLE acquisition, GPIO outputs, LCD, LEDs, buzzer, buttons, power and packaging.
ESP32 acquisition, validation, JSON payload generation, Wi-Fi/MQTT communication and local output control.
Node.js/Express backend, PostgreSQL/TimescaleDB, React/Vite frontend, Socket.IO and Cloudflare Named Tunnel.
Sensor comparison, NEWS2 scenario testing, IoT path testing, dashboard/LCD verification and analysis of 31 end-to-end measurements.
03 / SYSTEM ARCHITECTURE
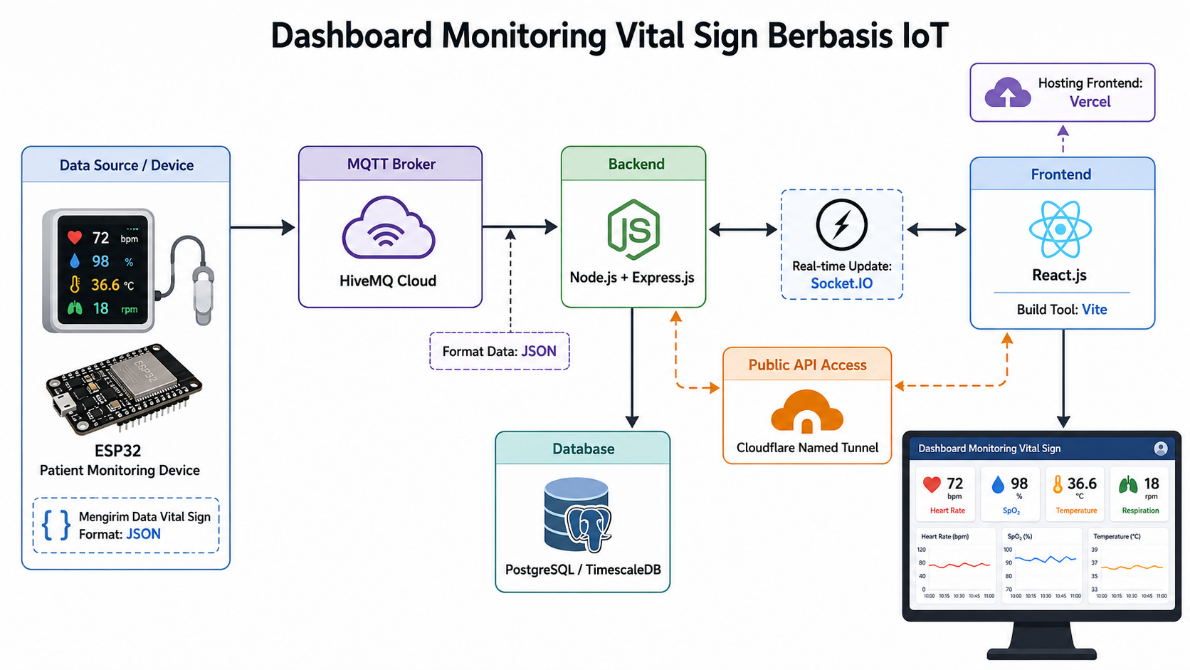
DEVICE → MQTT → BACKEND → DATABASE → DASHBOARD
ESP32 acts as the edge device. Sensor and OMRON data are collected locally, published in JSON through HiveMQ Cloud, processed by Node.js/Express, stored in PostgreSQL/TimescaleDB and pushed to the React dashboard through Socket.IO. The NEWS2 result is also returned to ESP32 for local display and alerts.
04 / HARDWARE INTEGRATION
ONE DEVICE, MULTIPLE DATA SOURCES
MAX30102
Measures SpO₂ through optical PPG. Pulse rate from this sensor is not used as the NEWS2 pulse source.
MLX90614 — Body Temperature
Non-contact body-temperature measurement, read digitally over I²C.
MLX90614 — Respiration Rate
Detects periodic temperature changes between inspiration and expiration to estimate breaths per minute.
OMRON HEM-7156T
Supplies systolic/diastolic pressure and pulse rate to ESP32 through Bluetooth Low Energy.
Local Interface
20×4 I²C LCD, LEDs, passive buzzer and push buttons provide local monitoring, navigation and alerts.
05 / ENGINEERING DECISIONS
TECHNICAL PROBLEMS I HAD TO SOLVE
01
DUPLICATE I²C ADDRESS
Both MLX90614 sensors use the default 0x5A address. Instead of changing EEPROM addresses, the design uses two ESP32 I²C buses. The primary bus carries MAX30102, body-temperature MLX90614 and LCD; the second bus is dedicated to the respiration-rate MLX90614.
02
RESPIRATION STABILITY
The respiration sensor does not directly output breaths/min. ESP32 detects temperature cycles. Baseline calibration and a fixed sensor position on the mask are used because movement, ambient temperature and mask leakage can affect the small temperature changes.
03
MULTI-PROTOCOL INTEGRATION
The system combines I²C sensors, BLE from OMRON, Wi-Fi, MQTT, REST/API processing and real-time web updates. Each layer was tested independently before end-to-end integration.
04
LOCAL + CLOUD OUTPUT
Monitoring must remain understandable at the device level. NEWS2 results are therefore returned from the backend to ESP32 for LCD, LED and buzzer output in addition to the web dashboard.
06 / DATA FLOW
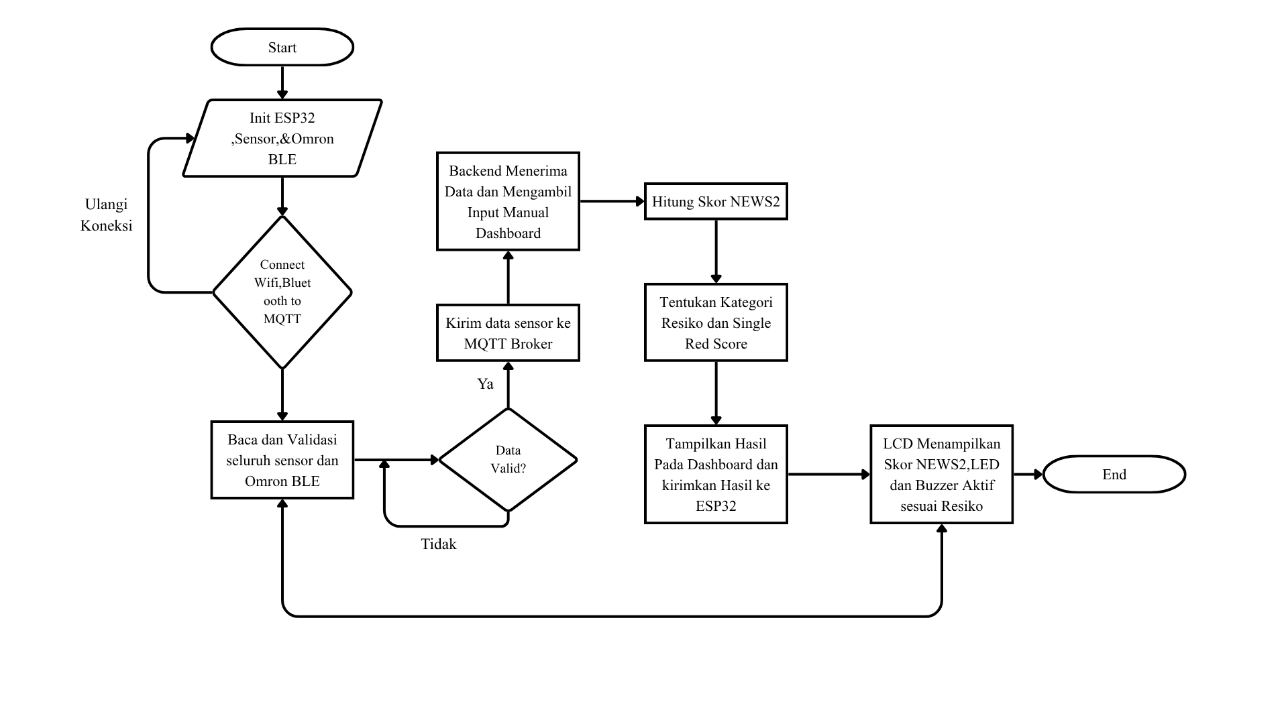
FROM INITIALIZATION TO RISK OUTPUT
- InitializeESP32, sensors, LCD, Wi-Fi, BLE and MQTT.
- Acquire & validateRead SpO₂, temperature, respiration data and OMRON pressure/pulse.
- PublishBuild JSON payload and transmit sensor values through MQTT.
- ProcessBackend merges automatic measurements with manual NEWS2 inputs.
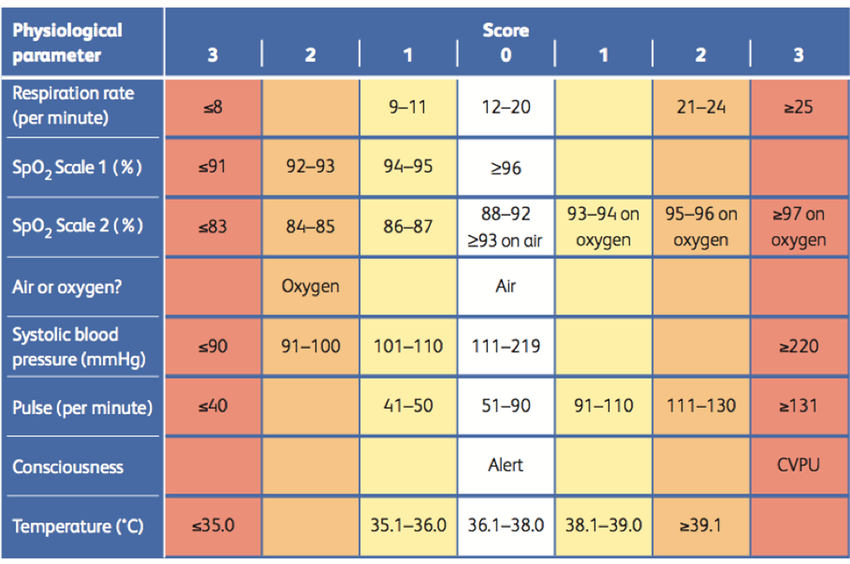
- ScoreCalculate partial scores, total NEWS2, risk category and single-red-score status.
- DisplayUpdate web dashboard and return results to ESP32 for LCD/LED/buzzer output.
07 / NEWS2 ENGINE
RISK SCORING, NOT DIAGNOSIS
The backend converts physiological measurements into partial NEWS2 scores and a total score. Manual inputs are used for Air/Oxygen, SpO₂ Scale and ACVPU because those parameters are not fully determined by the installed sensors.
NEWS2 supports early recognition and escalation. The prototype does not replace clinical judgement or medical diagnosis.
08 / DASHBOARD
REAL-TIME MONITORING + HISTORY
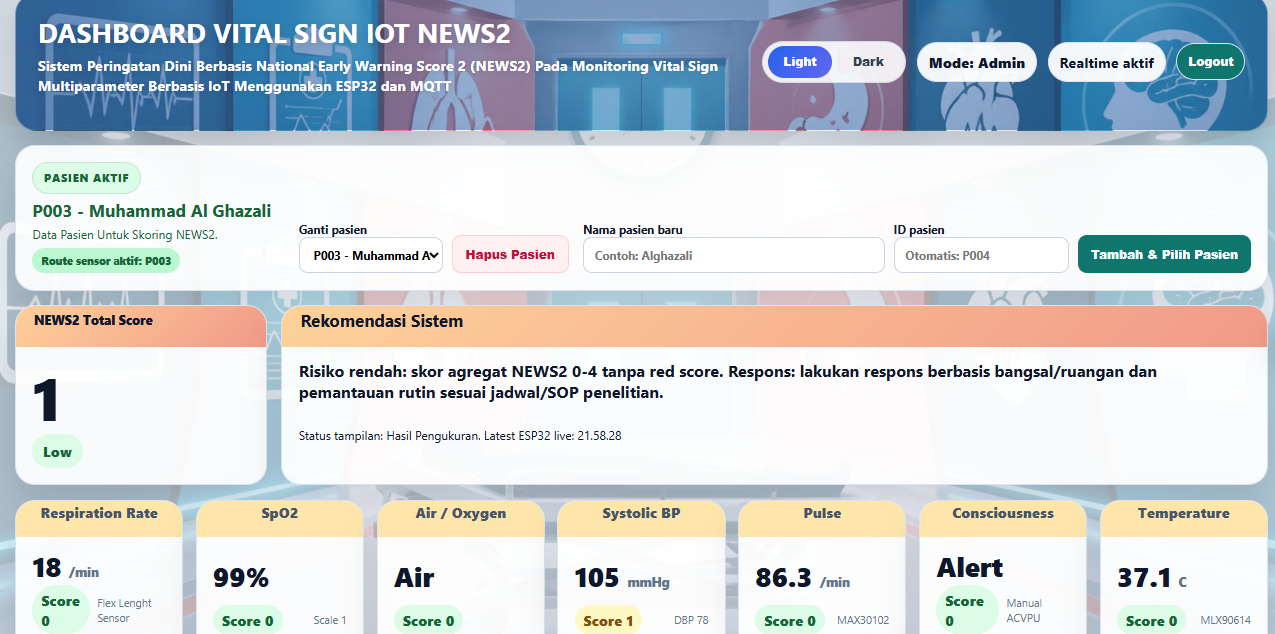
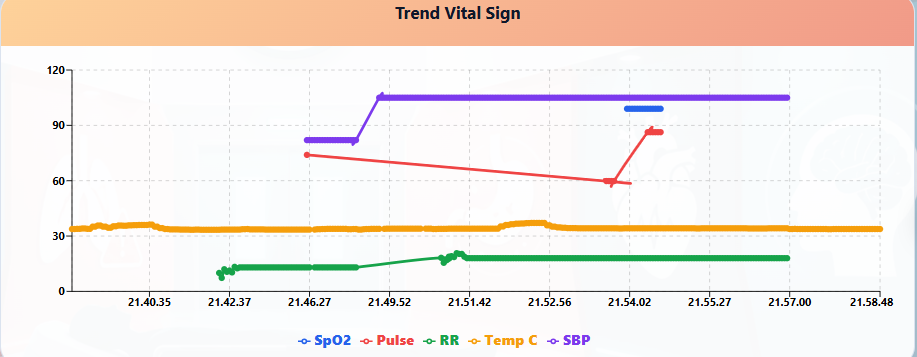
The dashboard provides active-patient management, real-time vital-sign cards, partial and total NEWS2 scores, recommendations, manual inputs, trend charts, device status, measurement history and Excel export.
VISIT NEWS2 LIVE DASHBOARD ↗
news2-iot-dashboard.vercel.app
09 / VALIDATION RESULTS
TESTED AT SENSOR, ALGORITHM AND IoT LEVELS
MAPE · 99.74% accuracy based on MAPE
MAPE · MAE 0.07°C · 99.81% accuracy based on MAPE
MAPE · 0.40 breaths/min mean absolute difference · 97.42% accuracy based on MAPE
Wi-Fi, MQTT, backend, database, dashboard, NEWS2 return path, history and Excel export passed.
31subjects · age 20–81
0–4observed NEWS2 range
1.00mean NEWS2 score
31/31classified Low Risk
No single red score was found in the 31 subject measurements. Separate score scenarios (0, 4, 6 and 9) were tested to verify low, medium, high and single-red-score behavior across dashboard, LCD, LED and buzzer outputs.
10 / IoT VERIFICATION
END-TO-END DATA DELIVERY
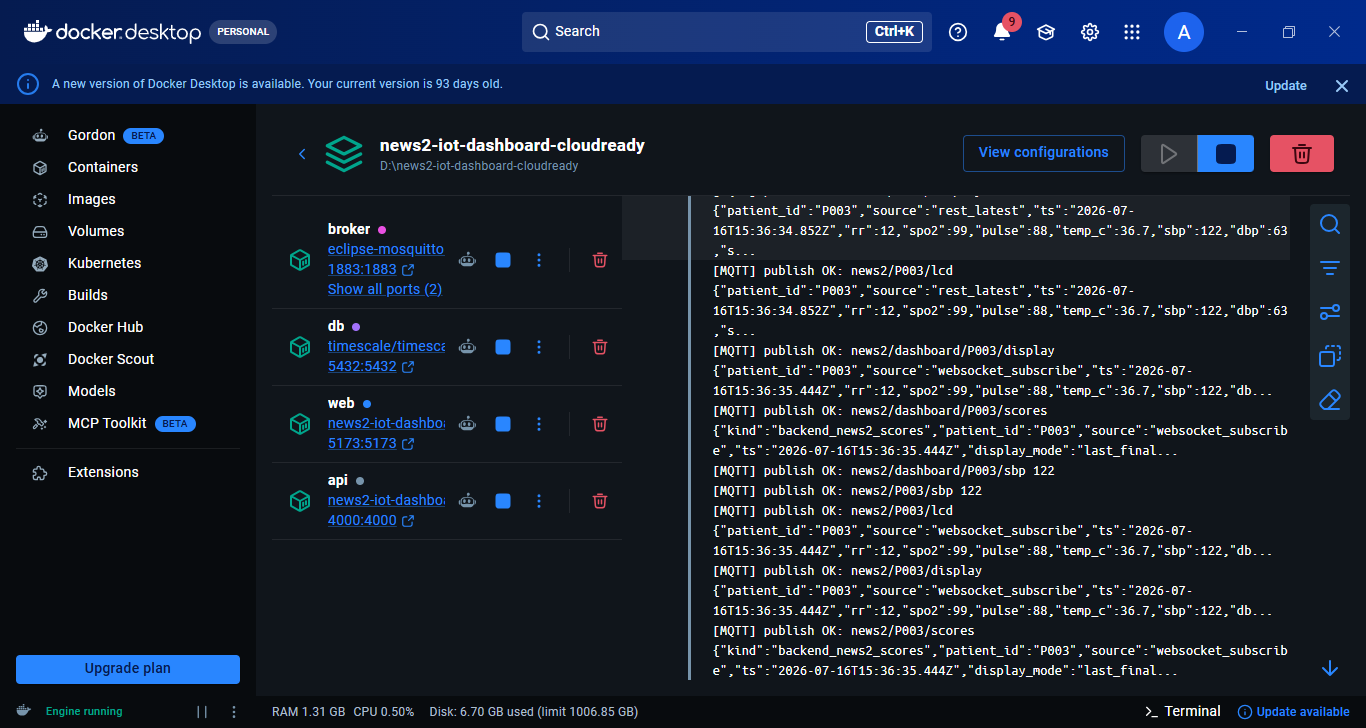
The data path was verified from ESP32 to Wi-Fi, MQTT broker, backend API, PostgreSQL/TimescaleDB, Socket.IO dashboard updates, and the return of NEWS2 information to ESP32/LCD.
- MQTT broker container active
- Database container active
- Frontend web active
- Backend API active
- ESP32 Wi-Fi connection
- MQTT connection
- Sensor payload delivery
- Backend processing
- Database storage
- Dashboard publish
- NEWS2 publish to ESP32/LCD
- Real-time dashboard update
- 31 measurements stored
- History exported to Excel
11 / LIMITATIONS & NEXT STEP
WHAT I WOULD IMPROVE NEXT
Use calibrated reference instruments, repeated measurements and broader test conditions for stronger measurement validation.
Improve robustness against mask leakage, sensor displacement, ambient temperature variation and irregular breathing patterns.
Move backend services from a local/Docker-hosted setup toward a continuously available production infrastructure.
Any real clinical use requires appropriate medical-device development, validation, governance and confirmation by healthcare professionals.
12 / FIELD DOCUMENTATION
PROTOTYPE TESTING
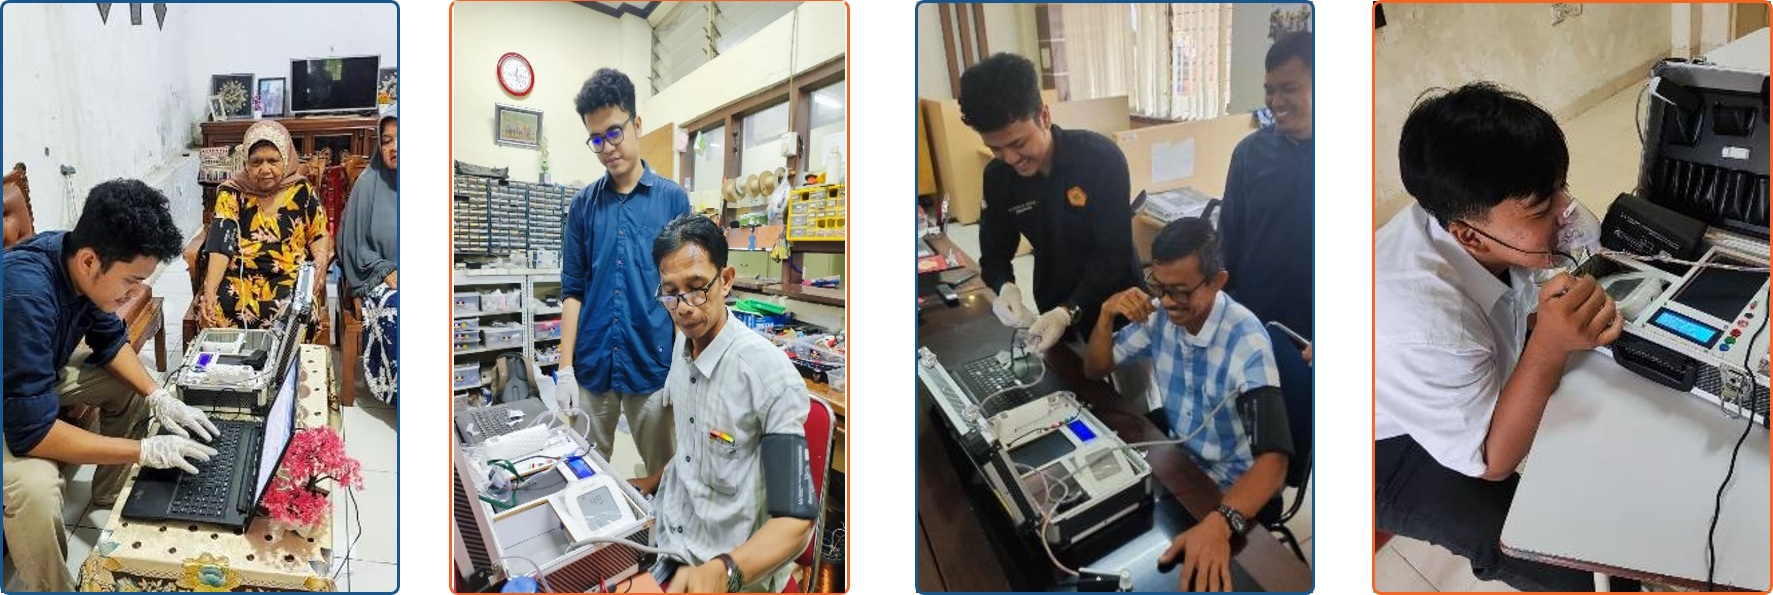
Testing included real device operation, sensor positioning, blood-pressure acquisition, dashboard monitoring and data collection across subjects of different ages.